






Conviva provides consumer-experience analytics for our customers, processing billions of events per day across their apps and websites. We recently introduced a feature called Predictive Intelligence that automatically identifies factors that strongly drive conversion in user workflows. This is the first in a series of posts about the technical ideas behind it.
The Problem
Consider checkout flows on an e-commerce site. Thousands of users start purchases each day, and some fraction don’t finish. You want to know why: Is it a browser issue? A device? A failing API endpoint? In a real site there are thousands of potential explanatory variables.
This is a discovery problem over high-dimensional observational data, which makes it fundamentally different from A/B testing. You can’t run thousands of A/B tests for every possible factor, and many factors (device type, network conditions) aren’t under your control anyway. You have to work with the natural variation in the data you already have.
One common approach is to manually inspect individual sessions. This is expensive—a PM can easily spend hours chasing a symptom that turns out to be a red herring. It also struggles to tease out more subtle problems, like a UX friction that makes users only marginally less likely to succeed.
Why not coding agent + DB?
Feeding billions of clickstream events to an LLM is not a good approach; LLMs are useful for summarizing individual sessions, but are not designed to discover statistically robust patterns across huge datasets.
Since AI agents have become ubiquitous, a standard approach could be an off-the-shelf coding agent, with access to an off-the-shelf query engine on top of clickstream event data, that can wield a variety of statistical tools to discover patterns autonomously. In our experience, such systems are not yet capable of reliably solving difficult problems like this, and it is difficult for users to validate their results. However, AI agents provide an incredible orchestration capability, and ML systems like Predictive Intelligence fit nicely as tools to empower them.
A Worked Example
We’ll illustrate with a scenario based on checkout flows at a real e-commerce site. There are two real causes of checkout failure:
- Mobile Device: Mobile users complete checkout at lower rates—many are just browsing, not committed to buying
- API Failure: Some users hit backend API failures that block checkout
But our data also contains three other factors that are correlated with checkout failure without independently causing it:
- US Daytime: More users browse on mobile during US business hours (work, commute)
- Social Media Referral: Users arriving via social media links (more common on mobile)
- Search Discovery: Users who found products via search rather than browsing
These three are red herrings. US Daytime is upstream of mobile (more people use phones during work hours). Social Media Referral and Search Discovery are downstream (mobile users are more likely to come through social media apps and to use search). All three inherit the association mobile has with checkout failure, without causing failure themselves.

Figure 1. Mobile Device and API Failure are the true causes; the other three factors are correlated red herrings.
Naive Approach 1: Single-Factor Comparisons
The simplest thing to try is comparing outcomes one factor at a time: what’s the success rate for mobile vs. desktop? During US daytime vs. off-hours?

Figure 2. Univariate success rates by factor value. Red bars highlight factors that appear problematic.
All 5 factors appear problematic. This is the familiar confounding story: US Daytime, Social Media, and Search Discovery show lower success rates because they’re correlated with mobile usage, not because they independently hurt conversion. The result is a dashboard full of “findings,” most of which are echoes of the same underlying issue. API Failure, one of the two real problems, is lost in the noise.
Naive Approach 2: Multi-Factor Combinations
A more careful approach is to stratify by combinations of factors: compare mobile users during US daytime vs. mobile users during off-hours, thereby isolating the time-of-day effect.
This addresses confounding, but creates a combinatorial problem. When we apply this to a real system, we end up with billions of combinations. Even with just 5 binary factors there are 32 strata to examine:
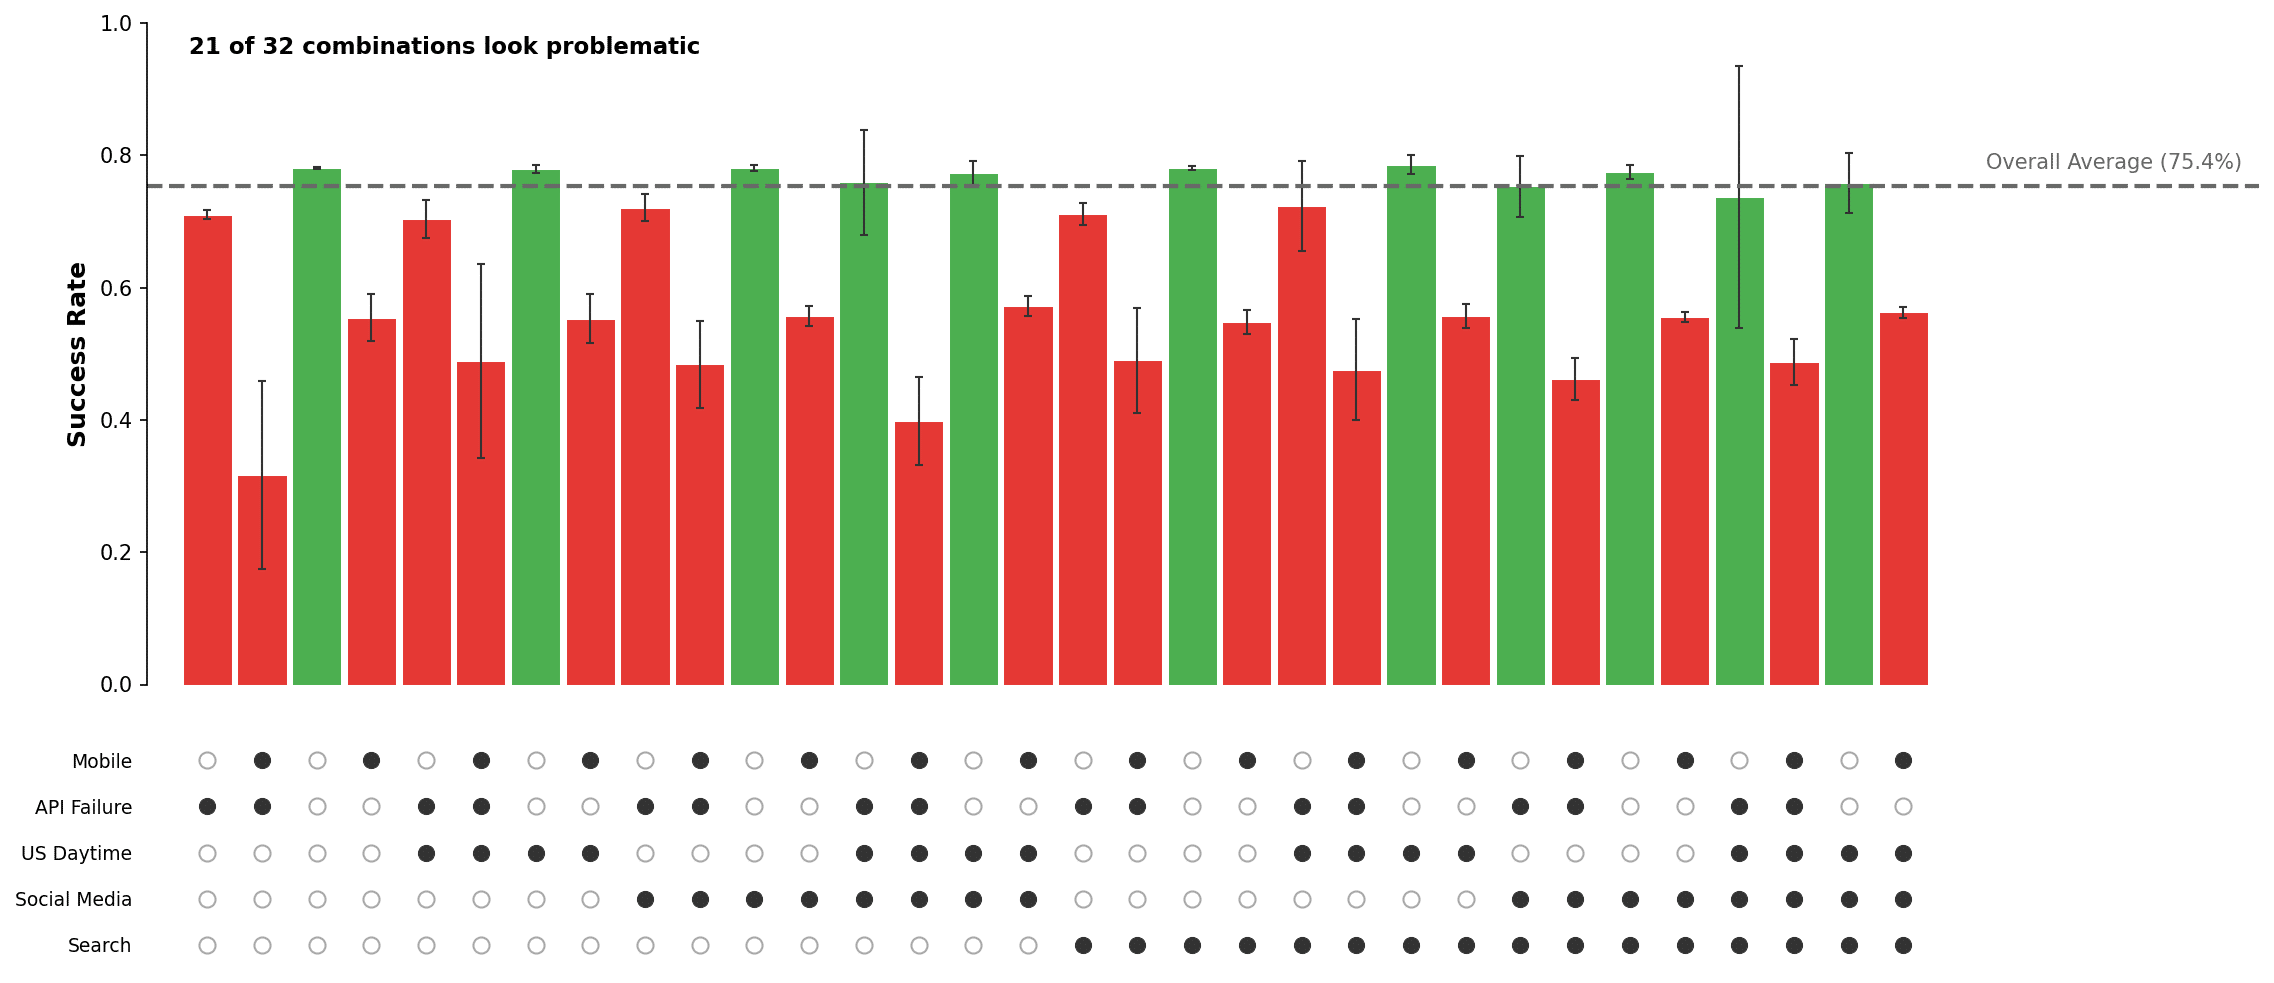
Figure 3. Success rates for all 32 factor combinations. Most flagged as problematic simply because they include a true cause.
Many of these strata look problematic simply because they include a true cause (e.g., mobile). The API failure signal is buried among mobile-related findings, and it’s still unclear whether the mobile problem is really about devices, time of day, referral source, or search behavior.
What’s Missing
The right intuition is to compare outcomes while controlling for the other observed factors—e.g., compare search vs. non-search users who are otherwise identical in device, time of day, etc. However, doing this manually is impractical: you’d need 16 controlled comparisons per factor, many with sparse data, and no principled way to reconcile conflicting results across strata.
We need a method that estimates each factor’s effect while simultaneously adjusting for all the others. This is what multivariable modeling does.
Regression-Based Attribution
Practitioners in epidemiology, economics, and clinical trials have long used regression models for exactly this problem: estimating effects from observational data with multiple confounders. For binary outcomes like conversion, the standard tool is logistic regression.
Results
Here is the logistic regression output for our example:

Figure 4. Regression-based effect sizes relative to baseline. Only Mobile Device and API Failure show significant negative effects.
The model gets this right: It estimates large negative effects for Mobile Device and API Failure, and near-zero effects for the other three correlated but non-causal factors. This matches the ground truth.
Why It Works
We’re really looking for factors whose effects remain stable across many different contexts in the data. If mobile hurts conversion, it should hurt conversion whether it’s daytime or nighttime, whether the user arrived via search or browsing. We want to find effects that generalize across the data, not effects that only appear in one specific subgroup.
Logistic regression does this by estimating a single coefficient for each factor, the value that best explains the outcome across all observed combinations of the other factors. If US Daytime has no additional effect on conversion once you condition on device type, its coefficient goes to zero. The model handles the “controlling for other factors” step internally and simultaneously, which is exactly what was impractical to do by hand.
So What?
Regression modeling reduces the output of a root cause analysis from a long list of correlated findings to a short list of factors with stable estimated effect sizes. This makes investigation dramatically more efficient. There are fewer leads to chase and clearer hypotheses to test. For the same reason, it also reduces the risk of missing genuine issues that would otherwise be buried in noise.
Our system is running today to power Conviva’s Predictive Intelligence feature, which automatically surfaces conversion-driving factors for customers using Conviva’s Digital Performance Intelligence platform.
What’s Next?
Of course, regression only adjusts for factors we observe. If important variables are missing, the model can still attribute effects incorrectly. Regression can also confuse cause and effect (“reverse causation”). This is why production systems are multi-layered and combine ML modeling with domain knowledge.
Regression is part of a larger ML pipeline in Predictive Intelligence. Automated feature extraction finds more potential factors from clickstream data; careful regularization and validation across time slices ensure that the identified signals generalize beyond a single dataset. Temporal constraints avoid some cases of reverse causation. AI agents can further analyze examples and aggregate statistics to validate, explain, and deepen insights.
We look forward to exploring these topics in more detail in a future post.