






Part 2 of 2. Part 1: We replaced mmap with io_uring in our Rust query engine. It got slower.
Part 1 left us stuck: a compio-based io_uring rewrite running 60% slower than the mmap baseline it was supposed to replace. We’d added O_DIRECT and worked around Arrow’s copy-happy default buffer construction, landing at 16 seconds against mmap’s 13.6 — better than our first cut, still going backwards.
This post is how we got unstuck, and it’s less orderly than Part 1: logs, deep dives into io_uring and SQEs, and eventually the realization that our entire concurrency and I/O-submission architecture was wrong. We’ll also get into memory paging details that turned out to matter just as much as the io_uring plumbing itself.
TL;DR
- Chunk size barely matters on a warm ring — pick anything from 128 KiB to a few MiB. But the first 2 passes are always slow. Keep I/O threads long-lived.
- The core breakthrough: firing one giant SQE per column (~40 concurrent, sometimes 650 MB each) was structurally wrong. Many small SQEs are what let the RAID stripe.
- A dedicated I/O thread (no async, no futures, just SQE submit and poll on one core) beat compio’s async abstraction for our workload.
- The biggest single win wasn’t io_uring at all — it was MADV_POPULATE_WRITE + HUGETLB, which cut memcpy wall-clock 3–4×.
- Bare-metal vs. the same code in a k8s pod: 20–30% faster.
Going back to basics: adding real logs
The lesson that stuck with me from this project: when you’re going in circles, you don’t need more theories, you need more data. So I stopped debating alternatives and added trace logs at every point in the Batch Materialization Layer — every prefetch submission, every materialize call, every io_uring completion — plus metrics on the column cache: hits, misses, in-flight counts, L1/L2 hits, ring depth, completions.
The cache metrics showed the layer working correctly — hits where expected, no unexpected misses, in-flight counts matching submissions. Nothing suspicious. The trace logs told a different story.
What the logs showed: the 2.5-second stalls
Here’s the pattern that showed up, sanitized:
04:01:35.484  batch=2 col=col_a       (in_flight=11)
04:01:38.017  batch=2 col=col_b       (in_flight=12)  ← 2.53s gap
04:01:40.682  batch=4 col=col_a       (in_flight=21)  ← 2.66s gap
04:01:43.312  batch=6 col=col_a       (in_flight=31)  ← 2.63s gap
04:01:43.314  ALL 40 completions arrive simultaneously
Every ~10 submissions, a ~2.5-second gap, then a burst of completions. Three stalls at 2.6s each meant about 7.8 seconds of a 10.6-second query was our own submission loop blocking on something.
But blocking on what? These gaps sit between two prefetch submissions for columns of the same already-open file. There shouldn’t be anything to wait on between two consecutive submissions.
Argument with Claude: the O_DIRECT theory
Claude had a confident answer: the gap was ext4’s O_DIRECT open path serializing under concurrent load, something about inode locking with multiple O_DIRECT reads in flight. Technical, cited kernel internals, sounded like something a kernel engineer would say.
Something felt off. openat is a metadata operation — files open in microseconds, even under heavy O_DIRECT concurrency. A 2.5-second file open isn’t a slow syscall, it’s a stuck one.
I asked Claude for a metric or log line that would distinguish “openat is genuinely slow” from “openat isn’t the slow thing.” It couldn’t produce one that wasn’t circular. So I ran a different experiment: moved fd.open() off the event submission loop and onto the async worker threads.
Opens dropped to ~5 milliseconds. Total query time barely changed.
The delay was never in the kernel. The openat completion had been arriving quickly all along — but because our submission loop awaited it inline, everything downstream stalled behind it. Stop awaiting inline, and the stall vanishes.
Worth being fair here: this wasn’t Claude being useless. The theory was internally consistent and cited real kernel behavior — if I hadn’t had the intuition that file opens should be fast, I could easily have accepted it. This became the first data point in a rule I kept applying: if a theory contradicts what you know about the basic cost of an operation, don’t trust the theory. Test it.
The stall was fixed. The query wasn’t.
The logs are clear now. Here’s the annotated timeline:
04:48:39.718  handle_prefetch completed in 0.343ms      ✓ (fix worked, no more stall)
04:48:39.719  all 40 file opens complete in <5ms        ✓
04:48:47.025  first read completions arrive             ← 7.306 seconds after submit
04:48:47.031  batch=0 completions processed, materialize waited batch=0
04:48:50.209  materialize fast-path batch=1              ← 3.178 seconds later
04:48:50.219  fast-path batch=2..6
04:48:50.314  materialize waited batch=7 (last in-flight col)
The prefetch stall is completely fixed — all 40 tasks spawn in 0.343ms, all 40 file opens complete in under 5ms. But the reads themselves take 7.3 seconds for all 40 columns simultaneously. Every do_column_read shows ~7306ms elapsed. They all start together and finish together. This isn’t serialization — they’re genuinely running in parallel. The 7.3 seconds is the actual NVMe throughput limit.
40 columns across 8 batches, ~13.1 GB total, read in 7.3 seconds = 1.79 GB/s. That’s far below the 21 GB/s fio result — but fio was measuring sequential reads at large queue depth, and here we were doing 40 concurrent reads of large files.
Challenging Claude again on why the reads took so long, and feeding it the earlier fio output as a reminder, got us to chunk size.
Mystery 1: why do all 40 reads complete at the same moment, 7 seconds in? A batch-barrier problem. All 40 columns submit at once, and the pipeline blocks until all 40 complete before processing any — no column-level pipelining. The slowest read sets the wall clock for the whole first pass. The deeper cause: each column read was submitted as one giant SQE (up to 650 MB for a timestamp column). The kernel breaks that into many block-layer sub-requests internally, but from io_uring’s perspective it’s a single operation, and the RAID driver can’t pipeline sub-requests within one SQE as efficiently as it can pipeline independent SQEs. fio hits 20 GiB/s by submitting many small (4 MiB) SQEs concurrently — the RAID driver sees 128 independent operations and stripes them across all 32 NVMe drives at once.
Mystery 2: why is 1.79 GB/s so far below fio’s 20 GB/s? fio uses 4 processes × 32 queue depth × 4 MiB blocks — 128 concurrent 4 MiB SQEs hitting the RAID, ~4 concurrent requests per drive. Our app submitted 40 × 1 SQE of 300–650 MB each. The block layer serializes sub-requests within a single large SQE, and the RAID can’t see across SQE boundaries to stripe them. md0’s 32 drives, striped at ~512 KB each, give a full stripe width of ~16 MiB — a 650 MB read spans ~40 full stripes, but submitted as one SQE, the block layer issues them sequentially to the RAID, not in parallel. This was the first real “ah-ha”: giant SQE submissions were the main problem.
Chunk size doesn’t matter (mostly)
The obvious fix: break each column into many small SQEs, submit them all, let the RAID stripe them. Before rewriting anything, we wanted to know what chunk size to use, so we ran a fio sweep on real Arrow IPC files at varying block sizes:
| jobs | block size | bandwidth | avg clat |
|---|---|---|---|
| 1 | 128k | 5665 MiB/s | 0.70 ms |
| 1 | 512k | 5597 MiB/s | 2.83 ms |
| 1 | 1M | 5639 MiB/s | 5.60 ms |
| 1 | 4M | 5572 MiB/s | 22.68 ms |
| 1 | 16M | 5537 MiB/s | 87.08 ms |
| 1 | 64M | 5483 MiB/s | 277.70 ms |
Three lessons: reading from a single file, chunk size doesn’t matter — bandwidth holds steady around 5.5 GiB/s regardless. Using 4 rings or 4 threads instead of 1 made no difference; a single thread was more than fast enough. And a second sweep across multiple Arrow files showed the same thing. These numbers told us to stop tuning chunk size and focus on architectural simplification instead.
Chunking alone didn’t help
Armed with that, we chunked the giant column reads into much smaller ones, still on compio’s async framework, and made a few other changes along the way: turned each chunked read into an async compio task, added a semaphore to cap in-flight tasks (later removed as unnecessary), simplified the main event loop (a good change regardless of outcome), and added more debugging.
It didn’t help much — and under further concurrent testing, the new design was actually worse under concurrency.
That was a hard thing to accept: io_uring is genuinely good, and most databases have moved to it, but switching from mmap (OS-managed, effectively free to use) to io_uring and direct I/O means the application now owns everything — not just the reads, but multithreaded scheduling, queuing, and concurrency, on top of a cache we’d bolted on ourselves. It’s a big architectural change, and we weren’t going to get it right on the first pass. The chunking change alone hadn’t changed the architecture enough.
Re-architecture: dedicated I/O thread
After chunking failed to move the needle, it became clear the real problem was that one layer was doing too much: coordinating async futures, managing io_uring SQEs, feeding decoded bytes into Arrow, running the cache, coordinating with the query engine. All of that machinery adds cost without buying parallelism we couldn’t get from a plainer design — our workload is one query pipeline coordinating one dedicated I/O thread, not many independent async requests. compio is built for the many-independent-requests case; ours is the opposite.
The new design’s core idea: a thread dedicated to I/O, modeled on fio. fio is just a spin loop — no futures, no wakers, no executor. It submits SQEs, polls for CQEs, harvests them, submits more. That’s the whole thing, and it saturates the hardware.
- No asynchronous primitives — just the low-level SQE submission and polling interface of compio
- Given chunks of files to read; reads each region linearly, breaking it into smaller chunks as it goes
- Uses a round-robin mmap-backed buffer, so no allocations during a read

We built a standalone fio-style utility around this loop to test the ceiling before touching Arrow or application concerns — verify we could hit the fio limit, and play with iodepth, ring size, and chunk size in isolation.
Using a 4.8 GB Arrow IPC file and selecting the first 500 MB (roughly the size of a real column slice):
| Parameters | Pass number | I/O bandwidth |
|---|---|---|
| –chunk-kb 512 –iodepth 64 | 1–2 | 3635–3671 MB/sec |
| –chunk-kb 512 | 3–8 | ~5500 MB/sec |
| –chunk-kb 4096 | — | Identical results, confirming the fio study: no real variance with chunk size |
After 2 passes, we matched fio’s own numbers. Talking it through with Claude, it seems the first two passes are mostly io_uring warm-up — see the memory section below, which turned out to be mostly page initialization. SQ_POLL made no real difference given our direct polling model, and we hadn’t yet tried registered buffers (reportedly good for another 10%+). Turning O_DIRECT off produced startlingly high throughput, but that’s just warm page cache doing a memcpy — nothing to do with actual I/O, and not a real result.
On a different GCP box with 32 NVMe drives in RAID-0, we hit 20 GB/sec on a single ring:
| Parameters | Pass number | I/O bandwidth |
|---|---|---|
| –chunk-kb 512 –iodepth 64 | 1–2 | ~5200 MB/sec |
| –chunk-kb 512 | 3–8 | ~20000 MB/sec |
Three lessons from this exercise:
- Start simple — no async, a minimal utility and I/O-thread layer, mimicking fio.
- Separate the architecture into layers; separation of concerns makes each layer easier to test.
- Write a utility to benchmark each layer in isolation before wiring it into the real pipeline.
During this redesign we also added fair query scheduling to the BMT layer, round-robining across active queries to even out which batches get served first.
Parallel decoding on Tokio (Rayon nearly killed us)
Reads come out of the IOThread as raw DMA slices that need decoding and copying into longer-lived Arrow buffers — the CPU side of the pipeline, and one of Part 1’s promises for separating I/O from CPU work. We wanted parallel decoders.
First cut: a flat Rayon pool, one decode task per column, sharing the outer query’s Rayon pool. Not fast enough — big columns took disproportionately longer to memcpy than small ones, and the asymmetry didn’t have an obvious explanation at the time. (Foreshadowing: the real answer has almost nothing to do with Rayon — see the memory section below.)
Trying to close the gap, we nested a Rayon pool inside each decode task, breaking the memcpy into sub-chunks. It deadlocked. Tasks with longer memcpy times got stuck behind shorter ones, arena slots didn’t free in a predictable order, the IOThread stalled waiting for slots to reuse, and the pipeline seized up. Rayon’s fork-join model doesn’t guarantee fairness across nested pools — once you’re deep in a work-stealing hierarchy, task ordering is at the scheduler’s mercy, with no clean way to ensure long tasks release resources before short ones pile up behind them.
We moved decode coordination to Tokio instead. spawn_blocking runs the actual memcpy on a blocking thread pool while the outer Tokio task tracks completion, and a semaphore caps outstanding decodes so the IOThread can’t outrun the decoders and drain the arena — bounded concurrency at every layer. Tokio is just much better at any non trivial concurrency configuration, which ours was turning into, especially anything nested. No more deadlocks!
First real end-to-end numbers
With the architectural rewrite in place — IOThread, rebuilt BMT, Tokio decoding — we ran actual queries against the new stack:
| Small query | 11-day query | |
|---|---|---|
| Old mmap design | 4 s | 63 s |
| Our slow first-cut io_uring (single-threaded compio) | 6–6.5 s | 78 s |
| New IOThread + BMT + Tokio decoding | 3.3 s | 49 s |
| Same, with –no-o-direct | did not finish | — |
| Add HUGETLB + MADV_POPULATE_WRITE pre-warming | — | 45 s |
| Add larger caches (150 GB L1 / 200 GB L2 / 32 GB ring) | — | 37 s |
Three things worth noting. First, the architectural rewrite alone dropped the 11-day query from 63s (mmap) to 49s — the first time our io_uring path beat the mmap baseline it was supposed to replace, on real workload. Second, the –no-o-direct row is the counterfactual for the beautiful 62 GB/s fio numbers from earlier: on real concurrent queries, the same pipeline without O_DIRECT doesn’t finish. Those fio numbers were warm page cache lying to us — O_DIRECT is load-bearing. Third, the last two rows are why the next section exists: getting from 49s → 45s → 37s took the memory work below, plus careful cache sizing. Those wins turned “first time we beat mmap” into “meaningfully faster than mmap.”
The second investigation: memory strategy
49s was better than mmap but well below what the plumbing benchmarks said we should be capable of — the IOThread alone hit ~5 GB/s on the 2-drive box and ~20 GB/s on the 32-drive box in isolation. Something was still eating wall clock on real queries.
perf record showed Buffer::from_slice_ref and memcpy at the top of CPU. Surprising — memcpy on modern hardware runs 25–50 GB/s. Why was it dominating?
It wasn’t memcpy. It was page faults during memcpy.
Every fresh Rust heap allocation is zeroed and mapped lazily — the kernel hands you virtual address space but doesn’t allocate physical pages until you actually write to them. Writing to a new 4 KiB page for the first time triggers a minor fault. The kernel handles it quickly, a couple of microseconds, but for a 300 MB column being memcpy’d into a fresh buffer, that’s ~75,000 faults × ~2 µs each ≈ 150ms per column, purely in the fault handler. Multiply by columns per batch and batches per query, and a large fraction of runtime is spent faulting in destination pages. perf attributes it to “memcpy” because that’s the instruction touching the pages.
This is the same phenomenon as Part 1’s mmap page-fault storm, seen from the other side. Under mmap, faults happened because we were reading data from disk; under O_DIRECT plus a fresh Vec<u8>, faults happen because we’re writing into a buffer for the first time. The kernel doesn’t care why you’re touching the page — it insists on mapping it before letting you write. Removing mmap hadn’t removed page faults from our pipeline; it had moved them from the read side to the write side. (This only applies to fresh pages — once pages get recycled, it’s not an issue. But on a box with hundreds of GB of memory, that recycling can take a while.)
Argument with Claude, take three: dead-end memory hypotheses
This was the third time Claude was both helpful and confidently misleading in the same session. Theories that didn’t pan out:
- NUMA pinning, Claude’s first suggestion. The box has two NUMA nodes, and the NVMe controllers live on one. numactl pinning bought about 10% — real, but not the fix.
- MADV_SEQUENTIAL, proposed to hint at our access pattern. No measurable effect — that flag targets read patterns, not fresh-page allocation.
- MADV_COLLAPSE, to promote already-allocated 4K pages to huge pages after the fact. Sounded promising, didn’t work for us at all — it requires the 4K pages to already be faulted in, so you pay the fault cost before the collapse can help.
- Non-temporal memcpy variants to bypass the cache — already used by the default memcpy via glibc’s ifunc dispatch on modern CPUs. Nothing to gain.
Where Claude was genuinely useful: it pointed at off-CPU profiling frameworks I hadn’t considered, and when asked to write a small memory_test utility to systematically measure allocation and copy strategies, it produced a working benchmark in one shot. That utility is what cracked the memory story — the same pattern as the fio-style io_thread utility earlier: isolate the layer, sweep the parameters, let the numbers answer the question. Every time we followed that pattern, it paid off. Every time we tried to reason about a layer while it was tangled up with three others, we got stuck.
The memory_test results
100 MB block, memcpy repeated:
| Config | alloc | prewarm | copy | throughput |
|---|---|---|---|---|
| (a) HUGETLB, no prewarm, single-threaded | 0.01 ms | 0 | 27.32 ms | 3661 MB/s |
| (b) HUGETLB, MADV_POPULATE_WRITE, single-threaded | 0.01 ms | 10.27 ms | 7.67 ms | 13045 MB/s |
| (c) 4K pages, no prewarm, single-threaded | 0.01 ms | 0 | 34.21 ms | 2928 MB/s |
| (d) 4K pages, MADV_POPULATE_WRITE, single-threaded | 0.01 ms | 14.67 ms | 9.95 ms | 10068 MB/s |
| (e) 4K pages, single-thread prewarm | 0.01 ms | 14.82 ms | 10.55 ms | 9476 MB/s |
| (f) 4K pages, parallel N-thread prewarm | 0.01 ms | 2.17 ms | 13.42 ms | 7457 MB/s |
| (g) 4K pages, prewarm + parallel copy (Rayon) | 0.01 ms | 14.00 ms | 1.99 ms | 51207 MB/s |
Two takeaways here, arguably the most important thing in this whole post.
One. MADV_POPULATE_WRITE doesn’t make memcpy cheaper in absolute terms — it moves the fault work off the critical path. Compare (c) and (d): total work is roughly the same (~24ms vs. ~25ms combined), but it now splits into ~15ms of prewarm plus ~10ms of copy. Run the prewarm while the previous chunk is still being read from disk — a natural pipelining move once you own your own I/O thread — and you never pay the prewarm cost in wall clock. The copy on the critical path is now measured against pre-faulted pages, 3–4× faster than against fresh ones. This is the trick.
Two. HUGETLB adds another 30–40% on top. 2 MiB pages instead of 4 KiB means 1/512 the faults, plus a much better TLB hit rate for large accesses. Rows (a)/(b) vs. (c)/(d) show it: HUGETLB’s copy is ~10% faster, and — more importantly — its prewarm is ~30% cheaper. That compounds when prewarm sits on the critical path.
HUGETLB in a k8s pod is awkward — you need pod-level hugepages-2Mi requests, a properly configured kernel reservation, and enough node headroom to satisfy it. Where HUGETLB isn’t available, transparent huge pages (THP) sometimes get similar effects, less reliably, since the kernel decides when to promote pages and often won’t under memory pressure.
Final design: the buffer arena backing the IOThread’s ring uses anonymous mmap with MAP_HUGETLB where available, falling back to 4K pages plus MADV_POPULATE_WRITE. Prewarming happens on a decoder-side task issued before the byte slice arrives, so the memcpy always hits already-faulted pages. Parallel memcpy via Rayon (row g) adds another 4–5× on top when the decode workload is large enough to make the parallelism worthwhile.
This — not io_uring itself — turned out to be the single biggest source of end-to-end speedup once the I/O layer was working. It’s barely mentioned in the io_uring blogs, which focus on submission mechanics and ring depth. It’s the thing that took the longest to figure out, and the thing we’d tell anyone doing a similar migration to look for first.
Production results
With the full architecture in place, we ran a fair fight: same 192-core box, same 12-concurrent-query workload, same code, five runtime configurations. All io_uring configs use O_DIRECT; the baseline is our previous mmap deployment across 4 pods.
| Metric | mmap 4 pods | io_uring 1 pod, small cache | io_uring 1 pod, medium cache | io_uring 1 pod, large cache | io_uring native |
|---|---|---|---|---|---|
| Avg | 38.7 s | 87.8 s | 40.9 s | 24.4 s | 19.8 s |
| p50 | 27.0 s | 85.0 s | 35.0 s | 19.0 s | 14.8 s |
| p95 | 118 s | 148 s | 94 s | 58 s | 48.3 s (-59%) |
| p99 | 154 s | 199 s | 107 s | 105 s | 92.5 s |
Two findings jump out. Cache sizing matters a lot — enough that an undersized cache actively loses to mmap. With a too-small L1/L2 (second column), io_uring was more than 2× worse than mmap on average latency. If you don’t replace the OS page cache with something adequate, every warm-ish query pays cold-read costs, and you end up worse off than the thing you replaced. Medium cache brought io_uring to rough parity with mmap; large cache (L1 = 200 GB of predefined hot columns, L2 = 250 GB LRU) started to actually win — halving average latency and cutting p95 by 59%.
Bare-metal was 20–30% faster than the same code in-pod, same box, same cache config, same load. The pod tax comes from a few places: HUGETLB access (pods need explicit configuration to get huge pages, and often can’t get it), NUMA visibility (cgroup CPU allocation can span nodes in ways that break locality, and the I/O thread is much happier pinned to the NUMA node connected to the NVMe controllers), cgroup accounting overhead (small but nonzero per syscall), and reduced control over CPU pinning (the I/O thread wants a dedicated core, and pod scheduling doesn’t always allow it). If you’re doing this much work to get io_uring performance, running in-pod costs you a real fraction of the win — worth knowing before committing to a container-first deployment.
Post-deployment on the real query fleet, server errors dropped to near zero from the previous week’s baseline, average latency fell in line with the benchmark table, and the tail-latency heatmap tells the clearest story: the >1 minute blotches disappeared almost completely. L1 cache hit rate now runs above 75% consistently.
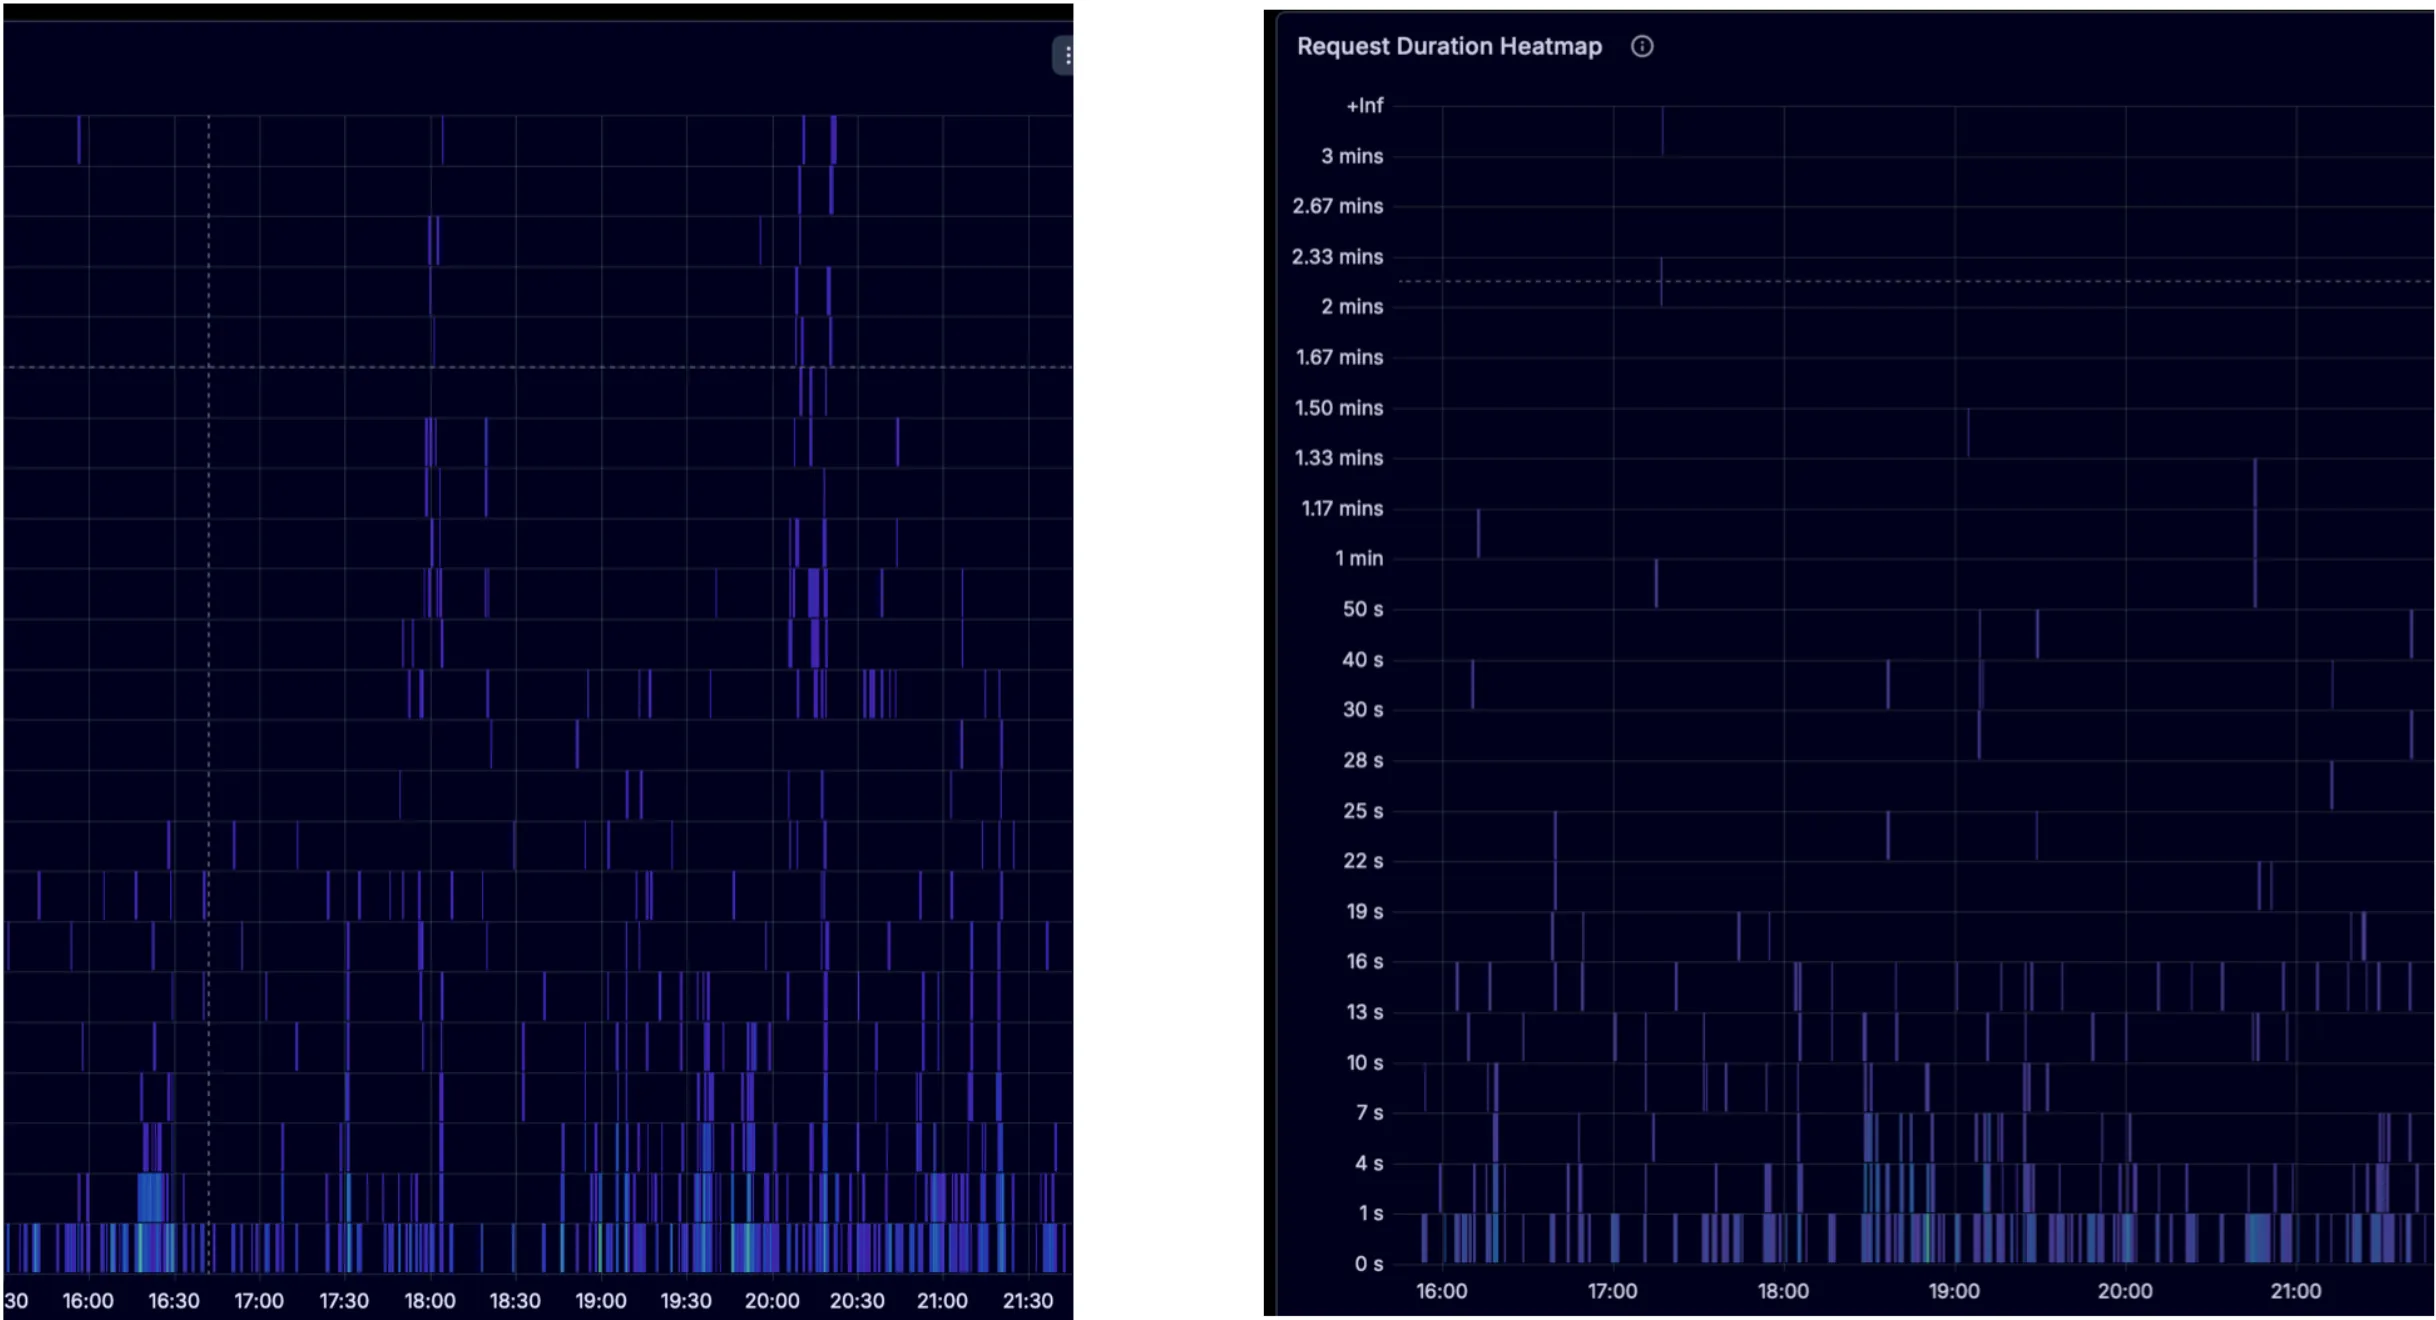
(Left = before, Right = after in the graphs above)
Debugging with an LLM in the loop
Three times in this project, Claude was confidently wrong at exactly the moment a plausible answer would have made me stop digging: the O_DIRECT open-serialization theory, the SQE queue exhaustion theory, several of the memory-strategy dead ends. Each time, the theory was internally consistent, cited real system behavior, and would have derailed the investigation if accepted.
What saved us each time was a bit of engineering intuition about the baseline cost of an operation. File opens are microseconds, not seconds. A ring depth of 1024 isn’t full at 48 items. MADV_COLLAPSE doesn’t work if you haven’t already paid the fault cost. When Claude’s theory contradicted a cost we knew, that was the signal to test rather than accept.
In fairness, Claude was genuinely useful across the project in specific ways: pointing at off-CPU analysis frameworks — bpftrace off-CPU profiling in particular — we wouldn’t have reached for on our own; generating utility code that worked one-shot (the memory_test utility that cracked the page-fault story, the fio chunk-size sweep script, the parallel-copy benchmark); working through the memory-strategy table and helping surface the pipelining insight that MADV_POPULATE_WRITE moves fault cost off the critical path rather than eliminating it; and handling analytical tasks with clear inputs and a defined output shape.
The through-line: LLMs are excellent instruments and unreliable diagnosticians. Use them for the instrument work — writing the utility, running the sweep, formatting the analysis — and keep the diagnostic judgment for yourself.
The rule we’d suggest anyone doing this kind of low-level perf work adopt: circumstantial evidence isn’t a root cause. Before believing any LLM theory about a performance problem, ask it to name a metric or log line that would distinguish the theory from the alternatives, then go collect that data. If it can’t produce something distinguishing, the theory hasn’t earned belief yet. Watch for a fluent explanation carrying an unverified claim — fluency isn’t correlated with correctness, and the most confident-sounding explanations deserve the most skepticism.
Final conclusions
- Separating out a non-async I/O layer was a massive win.
- io_uring is a serious commitment, but control over memory, caching, and tail latency are real wins.
- Chunk size doesn’t matter much.
- Stick to systematic debugging principles; avoid the AI doom loop.
- Tokio >> Rayon for this workload.
- HUGETLB is a win if you deploy natively; for pods, use THP.
The real cost of moving to io_uring plus O_DIRECT is that you now own the parts of the storage stack the kernel used to handle for you. That’s a serious commitment. The upside on the right workload is real — halved average latency and a 59% p95 reduction, in our case — but the work is split roughly evenly between io_uring plumbing and the memory strategy that turned out to matter just as much.
If you’re building on Arrow, Tokio, and Rust and hitting the same wall we did, that’s the map. Good luck.
Learn more at P99 CONF
I’ll be doing a deep dive on this topic at P99 CONF, online October 21–22, 2026 — a conference for developers who care about p99 percentiles and high-performance, low-latency applications.
Register here.