




Twenty million people don’t open a live sports app gradually. They open it ten minutes before kickoff, all at once. That’s exactly when one publisher’s Nexa data showed something breaking: pre-roll ad start failures spiking to 48 times their normal rate, right when everyone tuned in.
Nobody on the ad ops side would have called that a viewer experience problem. It showed up as a start-failure metric. Most publishers still run ad delivery, app performance, content discovery, and streaming quality through separate systems and separate teams, each with its own definition of a good session. The viewer never sees any of those seams, they only judge whether the quality was good while they were watching. That’s the case for measuring ad performance as part of the full viewer experience, alongside the app, the streaming quality, and everything else a viewer is living through in a session.
What a Stream Looks Like at Tournament Scale
During the 2026 FIFA World Cup, one major European live-sports broadcaster ran 1.42 billion ad attempts across its broadcast territories. Fill rate overall was strong, at 97%, and the tournament clearly worked commercially — leadership publicly credited it with driving ad revenue several times a normal month.
But the overall number was masking variation underneath. Broken out by market, one territory held a healthy 99% fill with 83% completion, a clean reference point for the rest. Another came in closer to 96% fill and 73% completion, with an estimated 14.6 million impressions that never filled at all. Nexa identified that discrepancy just by slicing it by market. But when it looked at where the ad sat in the viewing experience, the insights were even more interesting.
- Live mid-roll carried 88% of the tournament’s ad inventory and held up well: 98% fill, rebuffering around 1%.
- Live pre-roll was the kickoff-window spike already mentioned above: start failures at 48 times the mid-roll rate.
- VOD pre-roll had the slowest startup of any position, at 0.87 seconds, and the weakest completion rate.
- VOD mid-roll posted the best completion rate of the four, but only a 90% fill — a pattern that looks more like a yield question than a delivery problem.
That level of detail only surfaces when fill rate, completion, rebuffering, and ad position sit together in one view of the same session. The publisher’s ad ops team used Nexa to build exactly that view from its own instrumented data — in the time it took to write a prompt — and shared it with regional leadership. As the region’s head of ad ops put it: “Thanks for that, I find it very useful — and frankly it’s amazing to see how your Nexa solution has worked.”
A second Nexa run, scoped to a single match day, caught something a standard report would have buried in volume: at 18 million ad attempts that day, roughly 528,000 breaks went unfilled — about 3%, easy to lose inside a number that large. An estimated 59,000 of those were fixable before the next day’s kickoff — a recovery window that didn’t exist before. A publisher that used to wait until after the season to review ad performance was closing gaps like this mid-tournament, one match day at a time.
Why This Isn’t an Ad Story
Reading those numbers as an ad-ops win alone undersells what actually happened.
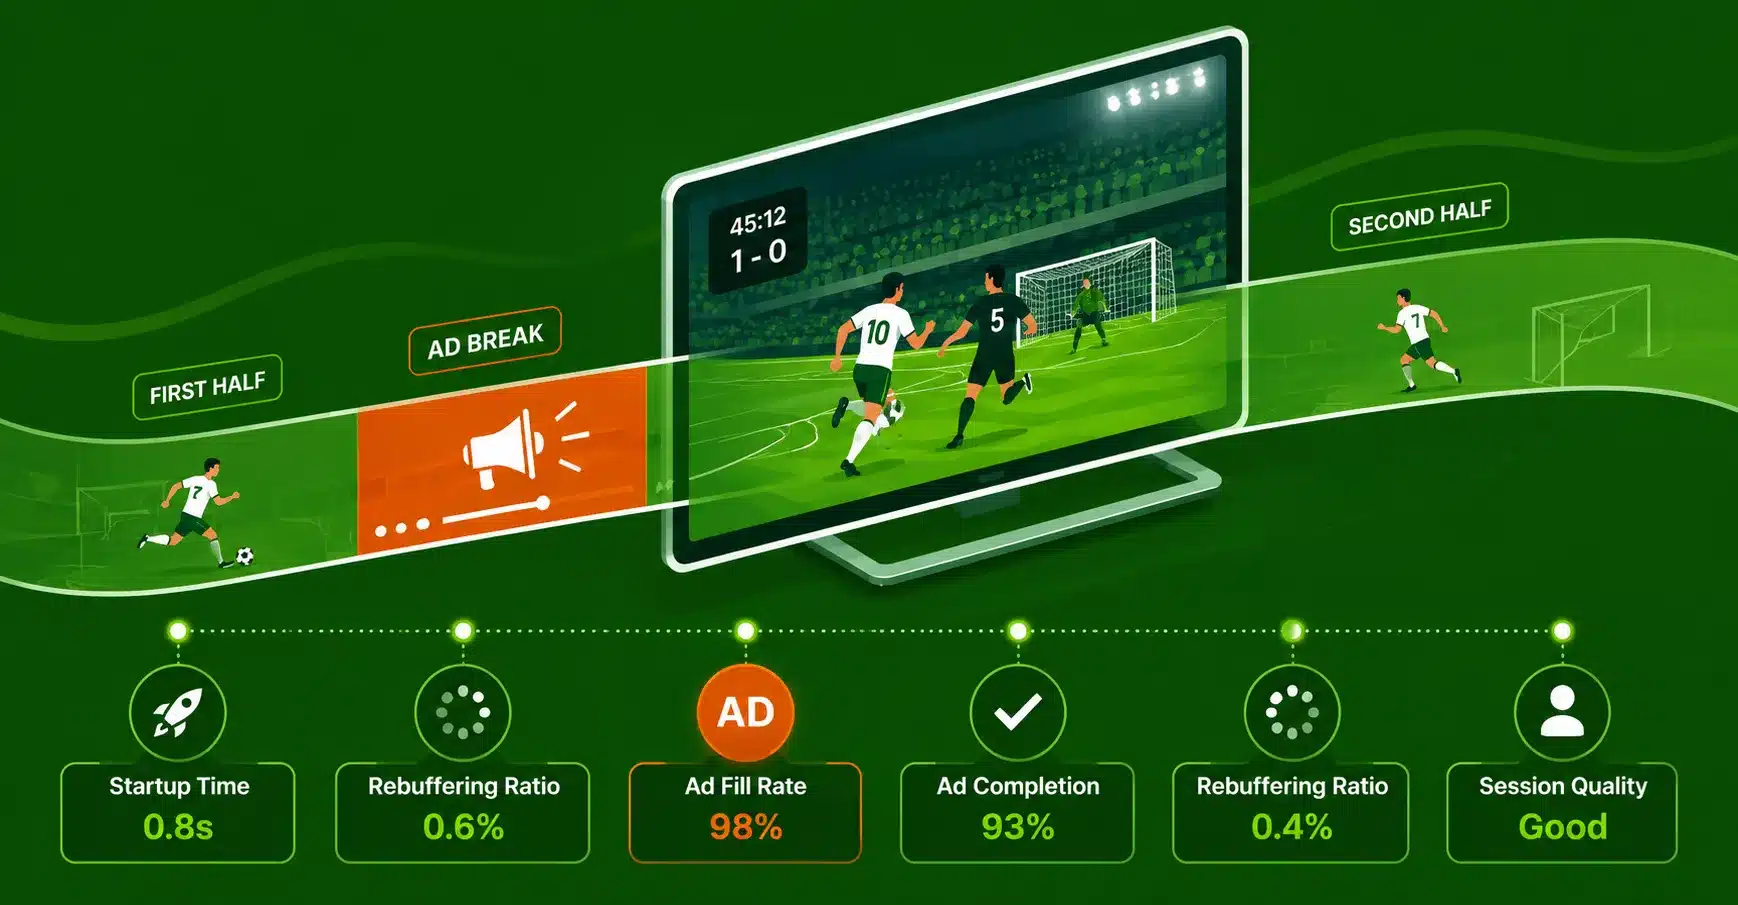
The signal that mattered was fill rate sitting next to rebuffering ratio, completion percentage, and startup time — the same measures a product or content team already uses to judge whether a viewer is having a good time watching a show, applied to the exact moment an ad occupies the screen. A mid-roll ad that rebuffers doesn’t just cost an impression. It costs the next few minutes of the match, and the viewer walks away associating that friction with the broadcast, not the ad vendor.
Ad experience sits inside viewer experience, and it holds up best when it’s measured with the same tools, by teams that can see each other’s data. Fill rate by itself just confirms inventory sold. Read alongside completion, rebuffering, and startup time, it starts to say something about whether the viewer actually had a good experience — the number that eventually shows up in renewals, well after this quarter’s ad revenue is booked.
As publishers add more digital touchpoints — companion apps, connected TV, new ad formats across live and VOD — that number of seams only grows, and so does the value of a single behavioral view spanning app, discovery, streaming, and ads together.