
When your north star business metric — whether it’s conversions, engagement, bookings, or another KPI — declines, do you immediately know why? How long does it take to get answers? How many people need to be involved? And how often do you never actually pinpoint the cause? On the flip side, you want to increase conversions. Do you know what levers to pull or are you always guessing?
Despite the abundance of product analytics, observability, and data warehouse tools, most companies are still left guessing. They struggle to answer fundamental questions like: Is the drop affecting a specific group of users? Is it caused by a technical performance issue, UX friction, or problems with pricing, a marketing campaign or product availability?
The Core Problem: Seeing What, Not Why
We have been asked by multiple retailers and travel & hospitality companies if there is a way to know immediately whether a drop in conversion is because of a technical issue, pricing, or something else like the weather or some other external factor. This is precisely where the union of product analytics, observability and data warehouse tools falls down.
Here is what a typical use of these tools looks like. Product and marketing analytics tools like Adobe and Google Analytics show what users are doing but fail to explain why they are doing it—or why they aren’t doing what you expect. You might notice a shrinking conversion funnel, but without deeper insights, you can’t determine whether:
- The app is waiting on the user (potential UX issue),
- The user is waiting on the app (a performance issue) or
- The user tried multiple times and gave up (a search or availability issue)
Without clear direction, the next step is typically checking an observability tool like DataDog, Dynatrace, or NewRelic to assess system performance. However, these tools lack user and business context, forcing teams into a “needle in a haystack” search where they attempt to fix everything just in case or spend hours and days trying to make a connection between the business KPI and system errors. This approach is costly, inefficient, and often fails to uncover the real issue.
As a last resort, companies turn to data science teams. This requires paying to move data into a data warehouse like Snowflake, Databricks or BigQuery, paying again to query it, and diverting data science resources from high-value projects. Even if actionable insights emerge, the process takes days or weeks—by which time the damage is already done, leading to poor customer experiences, lost revenue, and wasted resources.
Meanwhile, there is no time to focus on the real goal: improving your north star business metric.
The Broken State of Digital Business Performance Monitoring
To understand why product analytics, observability, and data warehouses fail to solve this challenge, we need to first define the critical requirements of an ideal solution:
Continuously compute and connect business, product, and technical performance KPIs in real time.
- This enables teams to quickly trace business impacts to their root causes.
- Most KPIs are unique to each application. For example, a product KPI could be the time taken from landing on the homepage to reaching a product detail page. These must be easily customizable for each website or app.
Analyze fine-grained customer cohorts.
- Broad cohorts like “web users” or “logged-in users” obscure critical patterns.
- Instead, teams must be able to analyze fine-grained “micro” cohorts—such as Chrome users searching for shoes in California in experiment group C while logged in.
- Without this level of granularity, businesses risk falling into Simpson’s Paradox and making misinformed decisions.
Automate insight generation in real-time for speed and efficiency.
- The sheer volume of data makes manual analysis impractical. Plus, no one has the time for manual analysis anymore.
- Automated analysis must be both real-time and cost-effective to be truly useful.
- Real-time insights enable businesses to act quickly, often while users are still engaged.
Why Existing Tools Fall Short
Even when used together, product analytics, observability, and data warehouses fail to meet these critical requirements.
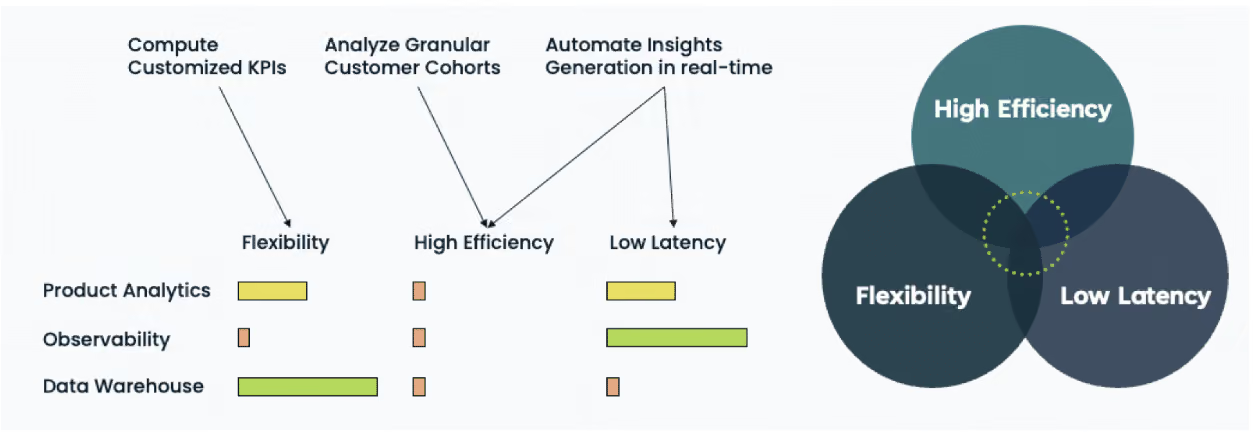
The reason? These platforms lack the core technical capabilities—flexibility, high efficiency, and low latency. The figure below illustrates how the critical requirements map to core technical capabilities.
- Computing customized KPIs for each app requires the solution to have the flexibility to understand and map the semantics of events specific to each app and compute KPIs relevant to that app.
- Detecting and analyzing granular customer cohorts in the tens of thousands requires extremely high efficiency. In fact, millions of customer cohorts need to be scanned to identify the most relevant ones.
- Automating insight generation in a timely manner requires extremely high efficiency because a lot more data needs to be processed compared to manual dashboard-driven analysis to get to meaningful insights and low latency in the order of seconds to minutes.
Product analytics, observability, and data warehouses each make different trade-offs among these, but none successfully meet all three together.
At Conviva, we believe that a new solution—with a new paradigm—is needed to solve this problem. We need a solution that connects the dots automatically, eliminates guesswork, and empowers teams to act in real time—enabling a new way to analyze, diagnose, and improve digital business performance. We gave this new paradigm a name — Real-Time Performance Analytics — and we will describe it in more detail in the next post.