
Top 6 Reasons Why Your Observability and Product Analytics Tools are Failing You eBook

Company leaders know they need to ask two key questions of their business:
How easy is it to use our products? and Did we exceed our customers’ expectations?
These questions are foundational to driving end-user engagement—but you’ve been trying to answer them with the wrong tools.
Every year, companies burn millions of dollars on traditional observability and product analytics tools—and they don’t have any ROI to show for it. Sure, they can monitor CPU or memory usage and track sign-up flows, but all that spend isn’t increasing engagement. Teams keep getting asked by leadership to prioritize work that actually improves the customer experience, but their data isn’t giving them actionable answers. Their tools are failing them.
You might know you’re losing prospects in your sign-up funnel but not know why. How will you find out when your analytics tools don’t support root cause analysis? Or maybe your CEO is blindsided by angry customers yelling on social media that your search feature is broken, so he calls YOU at 2 A.M. to fix it. When you look, you see that all API calls are working correctly. Why are your expensive tools not telling you what you need to know?
It’s simple: You’re not handling experience as well as you think. Product analytics looks at user engagement, while traditional observability gauges how well things are running. But they don’t measure how satisfied users are when they use your product, which is why you need to start thinking about the Quality of Experience (QoE). Metrics such as page load times and conversion rates don’t reflect QoE. Your existing tools leave you clueless about users’ real feelings. QoE computes user satisfaction, and satisfied users drive engagement.
To quote the late Steve Jobs, “You’ve got to start with the customer experience and work back toward the technology, not the other way around.”
Keep reading to learn the top six reasons why your observability and product analytics tools are failing you.
Traditional Observability
How well is my search working

Reason #1:
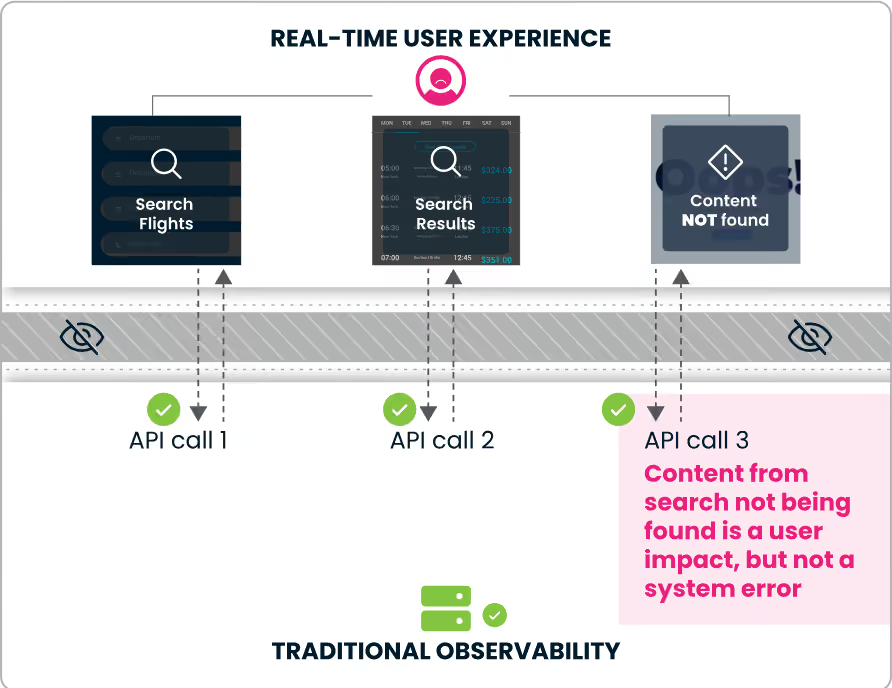
Traditional observability only captures system performance info and is blind to issues impacting customers.
Your Question:
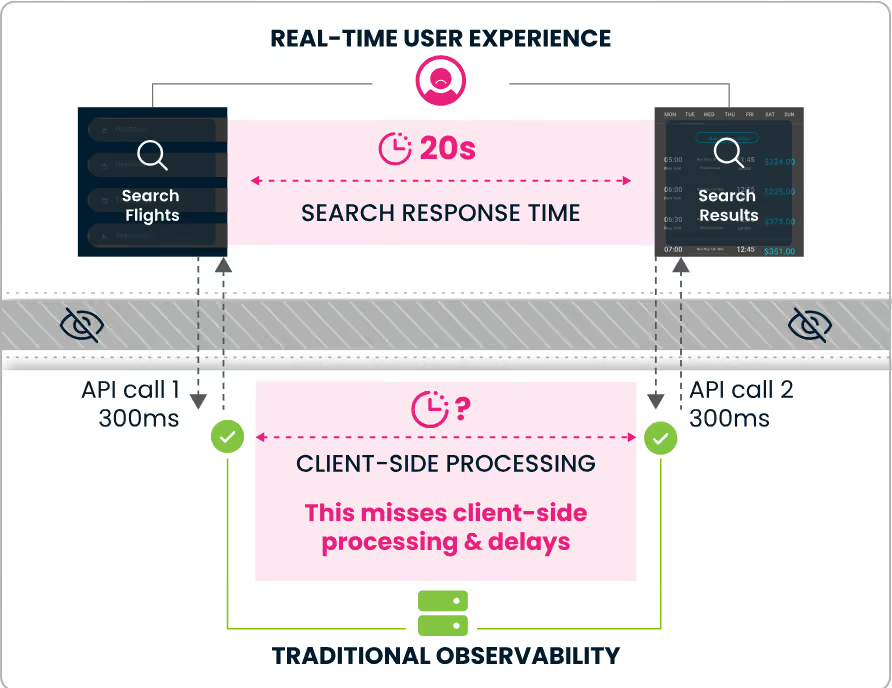
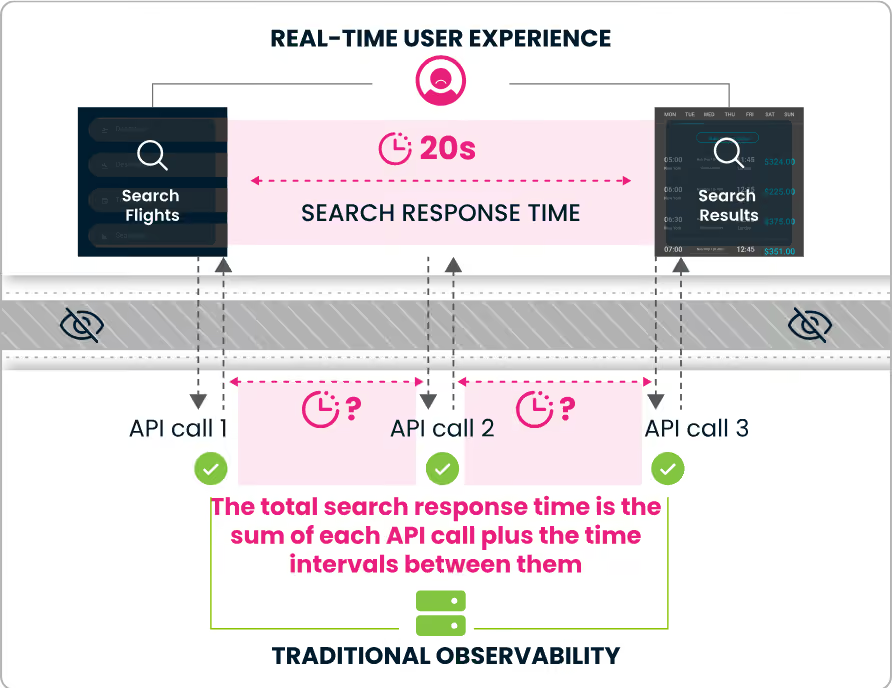
“Are my users getting fast search results?”
Possible Observability Answers 1:
“Yes, search API calls take 300ms.”
Possible Observability Answers 2:
“I can tell you the response time for each search microservice.”
Reality:
Users are complaining on social media that search is taking too long and is broken.
WHAT YOU NEED:
An end-to-end solution that computes Quality of Experience and prioritizes issues based on how much they impact end users.
Reason #2:
Traditional observability cannot quantify customer impact, and thus cannot prioritize what needs fixing.
Your Question:
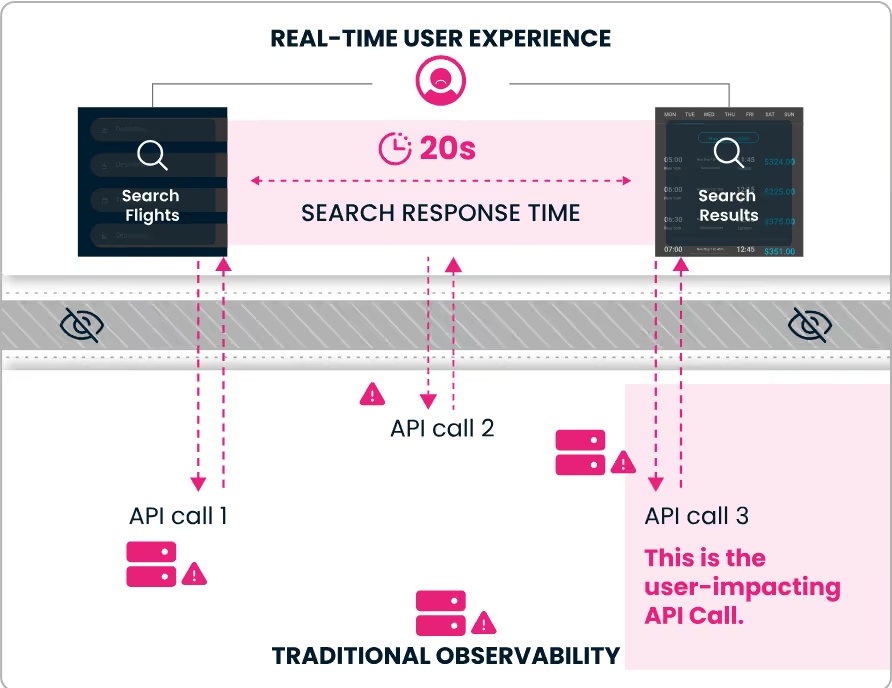
“Is my search functionality working properly?”
Possible Observability Answers:
“You have 157 alerts for API issues.”
Reality:
API call #3 is the root cause.
WHAT YOU NEED:
A solution that quantifies an issue’s impact on Quality of Experience, so you can fix issues that really matter.
Reason #3:
Traditional observability is plagued by loud alerting and false positives, making teams waste time chasing the wrong issue.
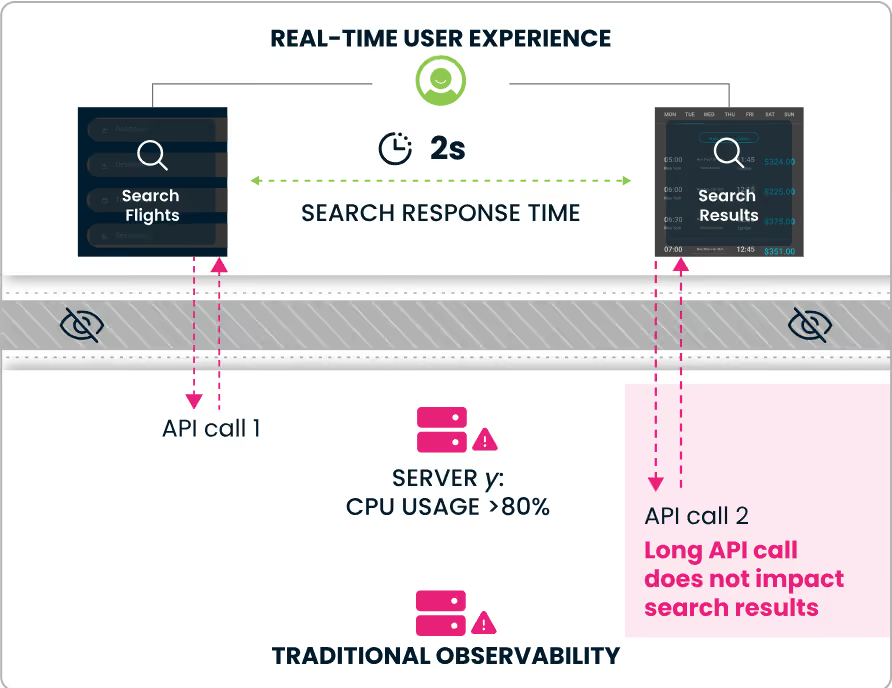
Your Question:
“Are my users getting fast search results?”
Possible Observability Answers:
“No, there’s a long API response.”
Reality:
There is a long API response, but it’s not impacting users.
WHAT YOU NEED:
A solution that escalates issues based on their cumulative impact on Quality of Experience.
Product Analytics
How well is my search working

Reason #4:
Product analytics only measures engagement and cannot tell you why something happened.
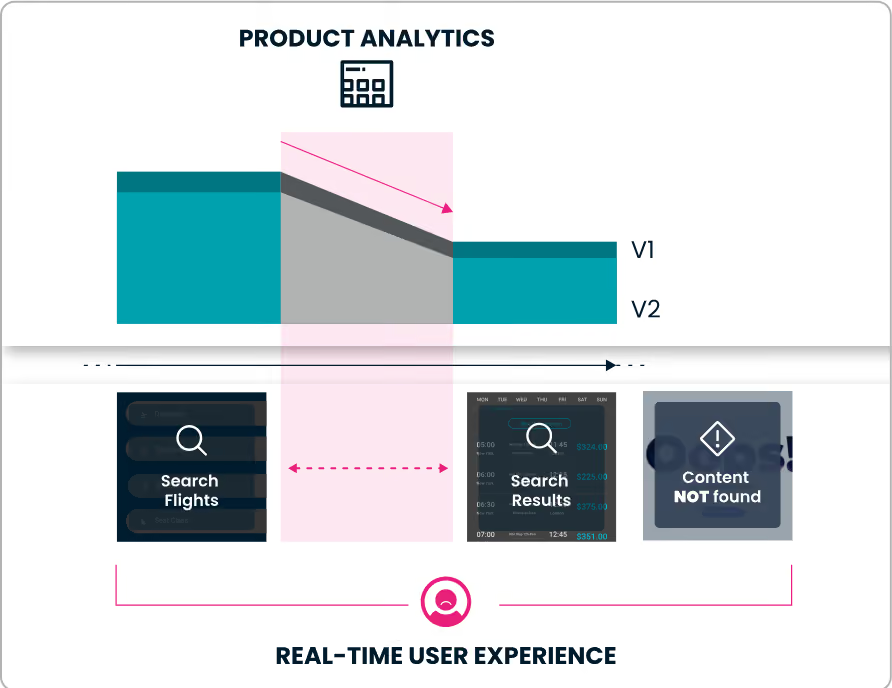
Your Question:
“Why am I losing so many users from ‘Search’ to ‘Book’ in v2?”
Product Analytics Answer:
There’s a 50% drop off between “Search” and “Book.”
Reality:
There are multiple reasons why you could be losing users, but your tool doesn’t tell you what they are, or which one is the root cause of the issue. You’re left guessing.
WHAT YOU NEED:
A solution that tells you WHY engagement is dropping, so you can fix it.
Reason #5:
Product analytics has no root cause analysis capability, causing disconnect among Product, Engineering, and Ops.
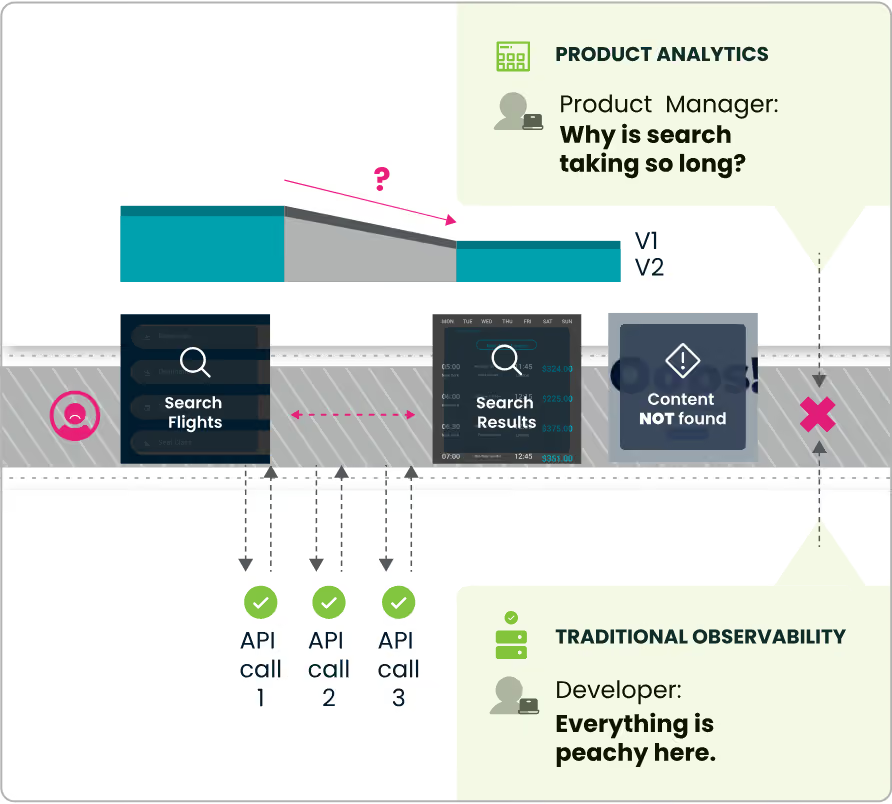
Your Question:
“Why is it taking so long to get search results?”
Product Analytics Answer:
“I don’t know. Check your Traditional Observability tools.”
Reality:
Customers are dropping off because their content is unavailable.
WHAT YOU NEED:
A single source of truth that all teams can leverage to identify issues and prioritize work that actually improves engagement.
Reason #6:
Product analytics lacks real-time monitoring and instant alerting, so it can’t solve issues as they happen.
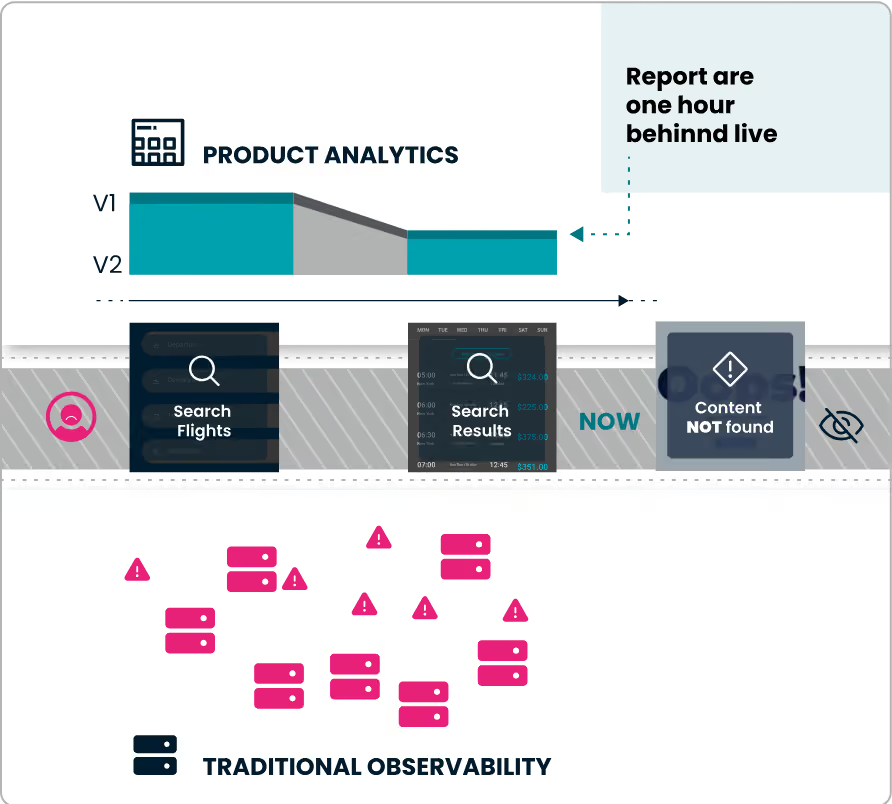
Your Question:
“Is search functioning right now?”
Product Analytics Answer:
“Everything looks fine.”
Reality:
Search is broken because of a server node failure, but your analytics tool is an hour behind live and you can’t see it.
WHAT YOU NEED:
Instant visibility into each viewer session as they happen, to protect every conversion point across your funnel.
Introducing the
Conviva Operational Data Platform
Experience-Centric Operations places users at the center of your data.
Conviva manages Quality of Experience (QoE) at internet scale by natively connecting user engagement to system performance. Not only does Conviva monitor and measure every user action in every application at census level, it also does this at lower cost than existing tools. With Conviva, you can convert raw events into Experience Data using our no-code UI to instantly identify and resolve issues that matter most, reducing churn and driving engagement—an industry first.
Consider this:
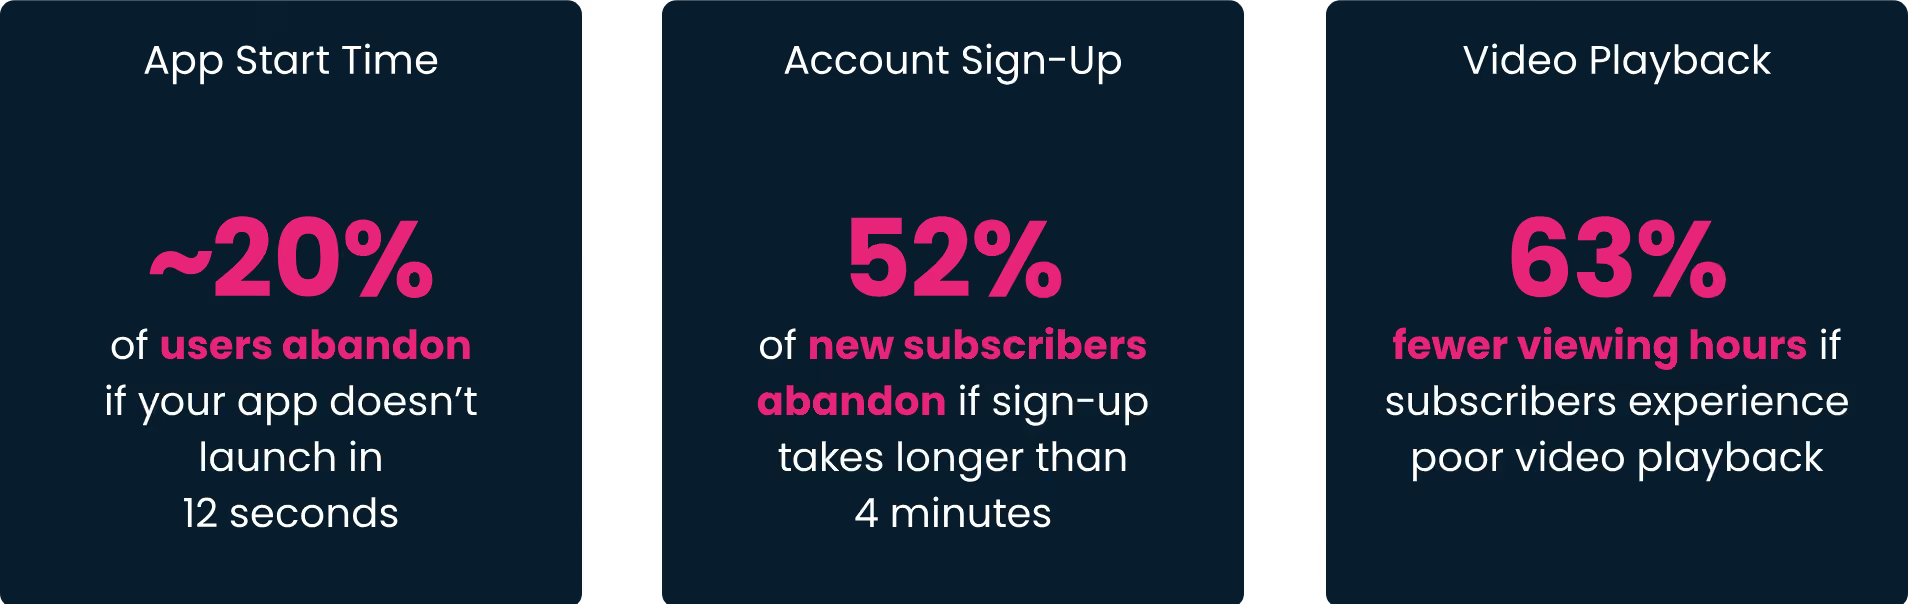
These QoE statistics are more than numbers; they represent missed opportunities to increase your subscriber base and, ultimately, your revenue.
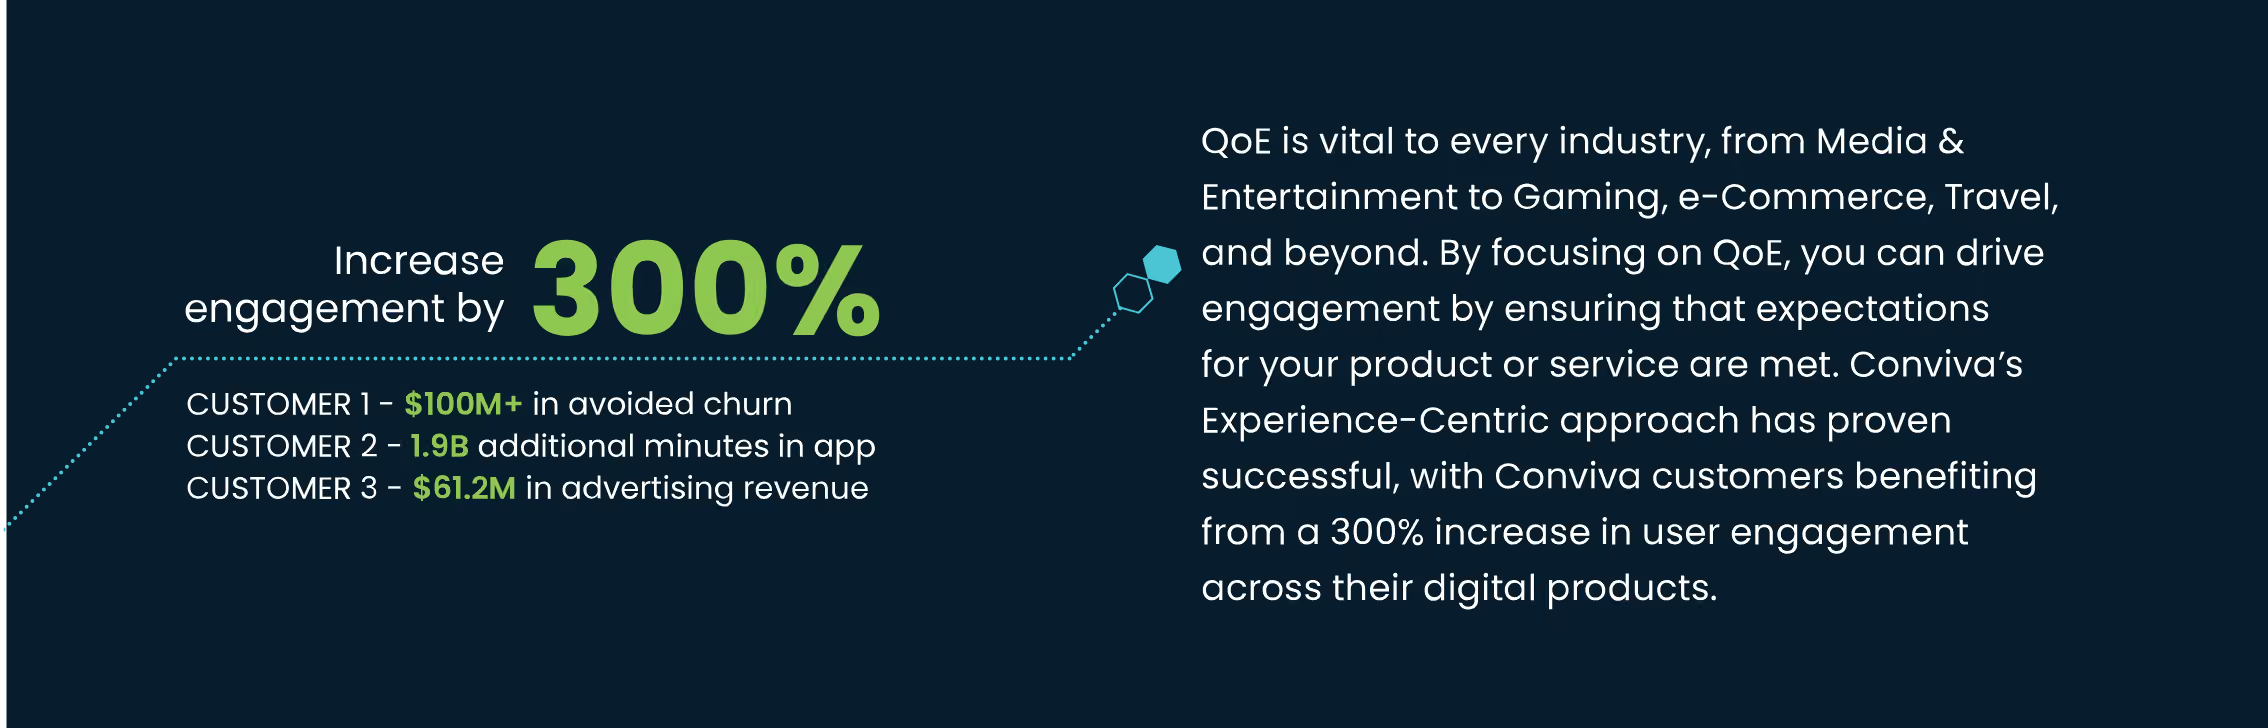
To learn more about how Conviva can help you boost engagement by 300%, contact our sales team today.
The Conviva Technology Differentiator
Conviva’s Operational Data Platform is the first and only solution capable of computing real-time visibility into QoE. Powered by proprietary Time-State Analytics Technology, all Conviva solutions are built on top of a non-tabular data abstraction and time-line query language that provide instant understanding of cause-and-effect relationships between front- and back-end systems.
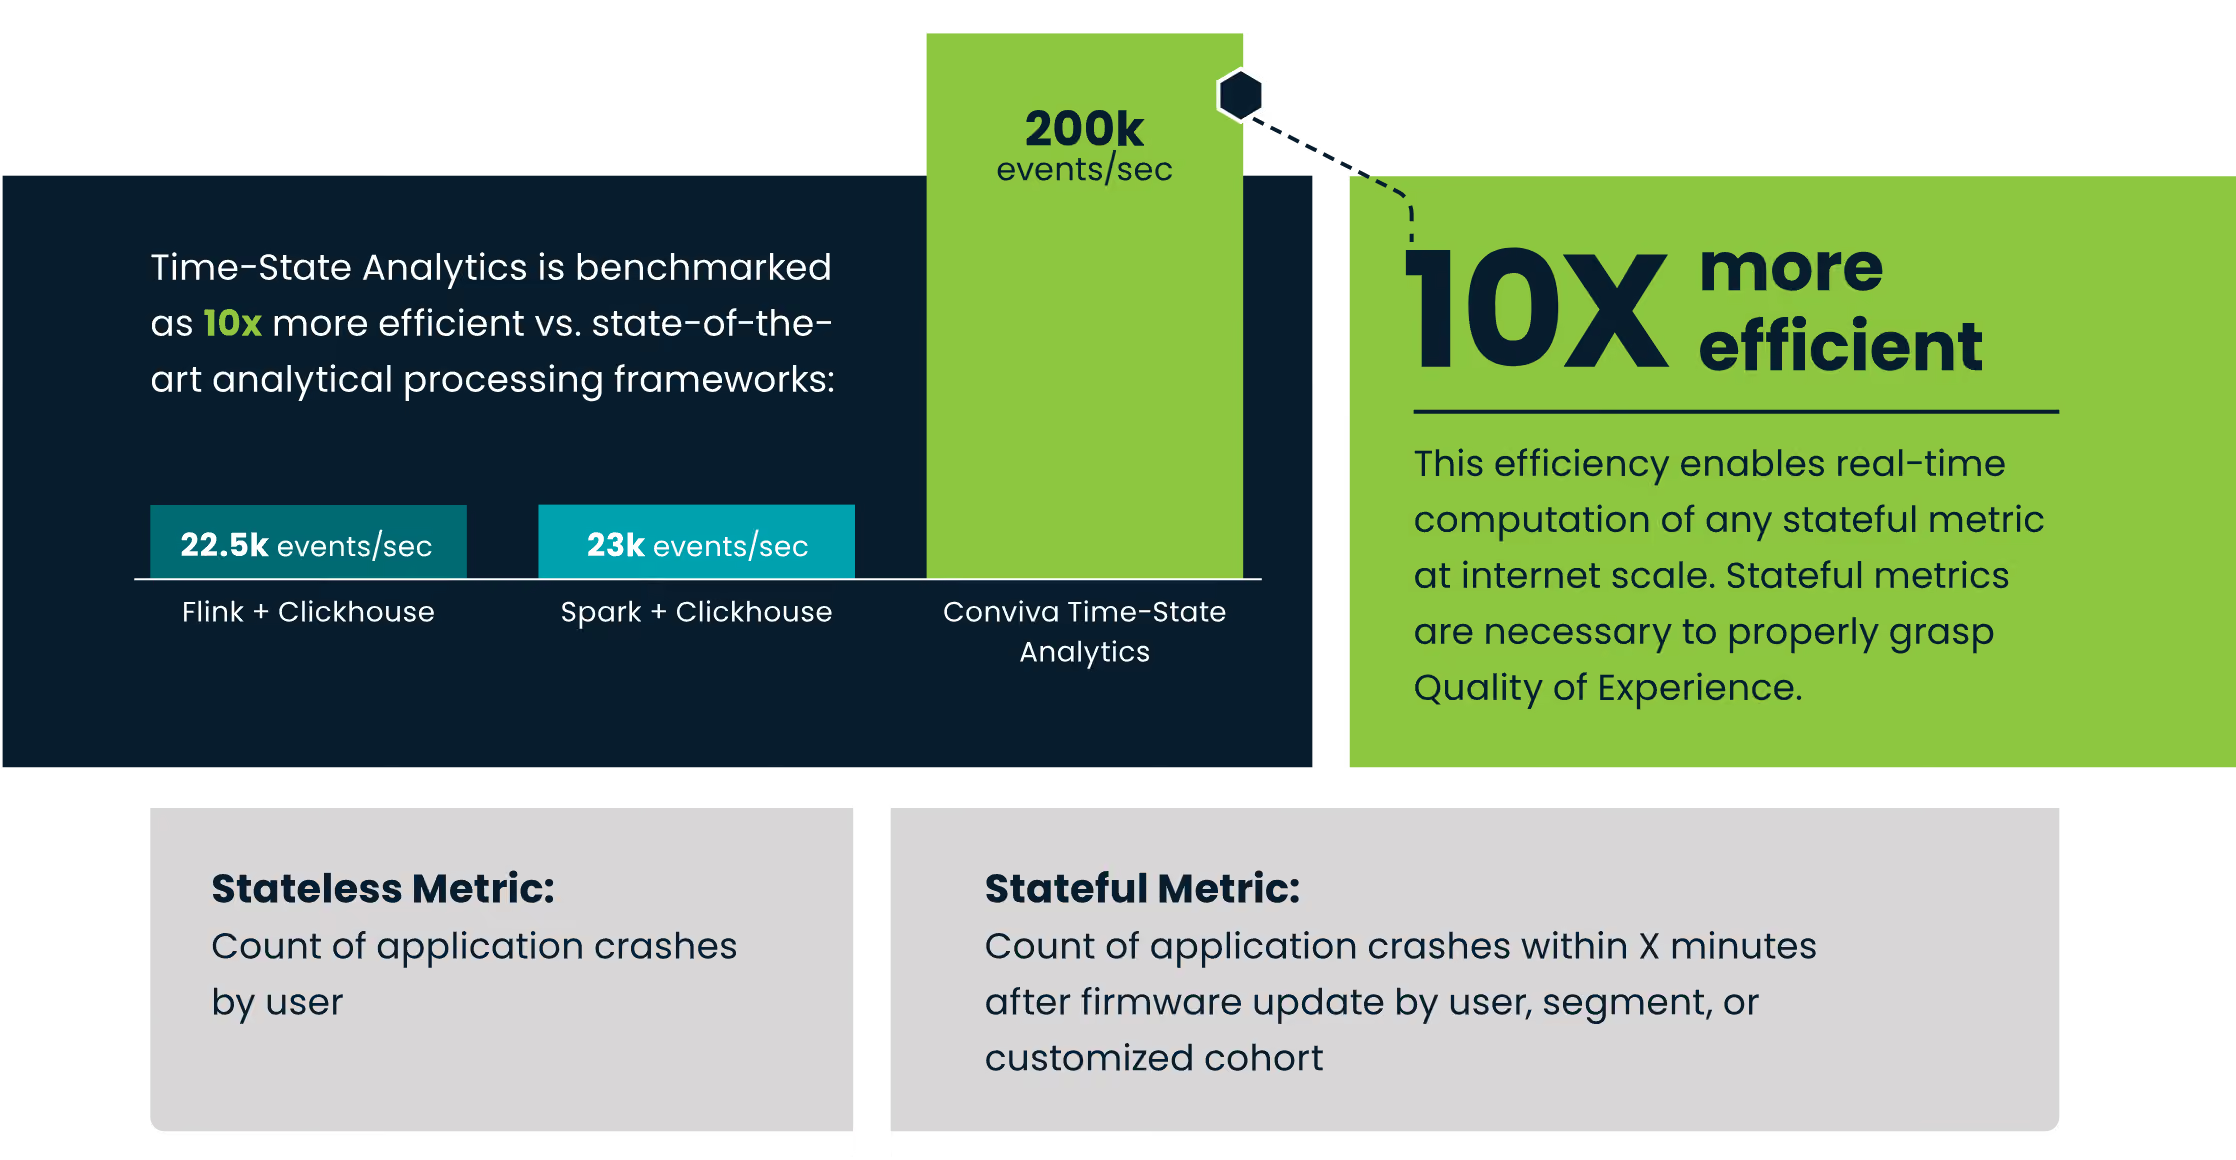
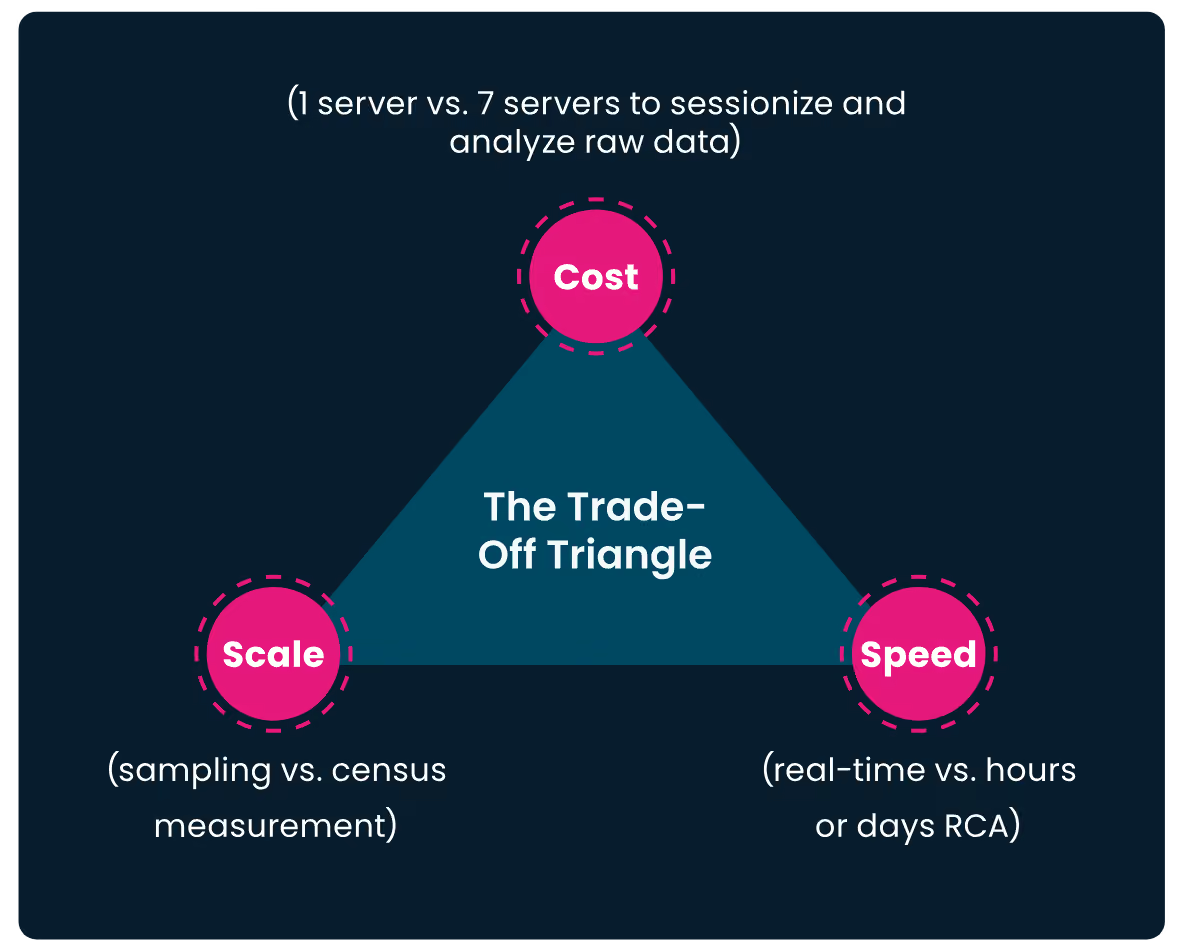
Stateless metrics will give you counts, but stateful metrics gives you far more context into what your user is experiencing and why. Although it is possible for other analytical processing frameworks to calculate stateful metrics, there is always a trade-off between scale (sampling vs. census measurement), speed (real-time vs. hours or days for root cause analysis), and Cost (1 server vs 7 servers to sessionize and analyze raw data).
Conviva’s Experience-Centric Operations is the only solution on the market that does not sacrifice scalability, speed, or cost. Not only does it ingest census-level data without sampling, it also computes stateful metrics instantly at a fraction of the cost of other frameworks, giving companies 360-degree visibility into real-time QoE. Remember that time you had to fix a major issue impacting subscribers, but the data you needed to quickly triage a solution was sampled out? With Conviva’s ECO, that will never happen again.
Conviva Core Capabilities
INGEST
Ingest and explore all data at minimal cost
- Census-Level Data Ingestion: Get real-time ingestion without data sampling from multiple clients via an extremely lightweight SDK.
- Block Events: You decide which data is important for your business. You don’t pay for the rest.
ACTIVATE
Build and activate only the events and metrics you need
- Event Mapping: Purpose incoming data wherever it is sourced using Semantic Mapper. Home in on the events that matter & align naming across disparate sources, all without needing to write a line of code. Apples now mean apples across iOS, Android, and more!
- No-Code Server-Side Metric Builder: Easily create metrics unique to your business using our UI, such as the time it takes users to subscribe, the number of users able to log in faster than 2 minutes, and more through our server-side Metric Builder. Conviva’s Metric Builder empowers teams to monitor and manage user experiences they know are important to their business without needing to update the SDK or prioritize new development.
MONITOR
Monitor and act on QoE while things are happening
- Issue Prioritization Based on Cumulative Quality of Experience (QoE) Impact: Elevate and resolve issues that impact a customer’s ability to use your product or service as they happen, from application launch to video playback and everything between.
- Clicks, Not Queries on Live Data: The Conviva UI enables Operators to double-click into any underperforming dimension, such as device type, CDN, OS version, ISP, region, or network request, and to drill down into an issue without needing to write a single line of code or query.
AUTOMATE
Automate detection, root cause analysis, and actions
- Artificial Intelligence Alerting and Instant Root Cause Analysis: Save your business more than 30,000 labor hours and millions of dollars in lost revenue with AI-driven alerts that surface anomalous events and point out issues you may not even know you should be looking for, delivering industry leading MTTD and MTTI.
- QoE CDN Switching: Conviva Precision optimizes both live and on-demand content for viewers across multiple CDNs in 190 countries. By monitoring real-time global and local internet patterns, Precision detects, locates, and resolves failures before they impact the end viewer, while keeping video delivery costs in check.
ASK
Find answers to questions you did not know to ask
- Dynamic Historical Dashboards: Conviva retains all Experience Data for 13 months, allowing operators to explore long-term trends and better understand how customers experience a product or service, including deployment tracking, usage data, demographics, and more, at no additional cost.